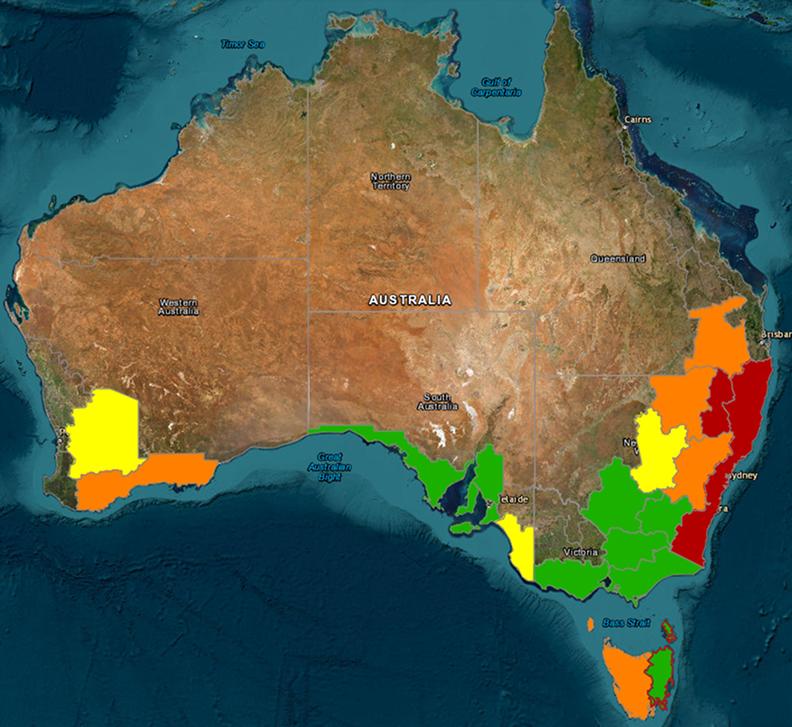
Welcome to the latest edition of the worm intensity heat map showing the parasite challenge across different regions of Australia. The continued surveillance of worm activity helps producers anticipate periods of greater risk and respond proactively.
This edition looks at data submitted in November. Read on to find out how your region has fared.
Remember that our map shows average worm egg counts, worm eggs have not been speciated. Where relevant, commentary regarding the potential species involved in the worm challenge is provided in the regional discussions.
For context, if you have found this website via social media, the map represents gastrointestinal nematode (otherwise known as roundworms, strongyles, or simply as ‘worms’) worm egg counts quantified from sheep faeces using the innovative FECPAK machines.

